


chemViz2: Cheminformatics App for Cytoscape
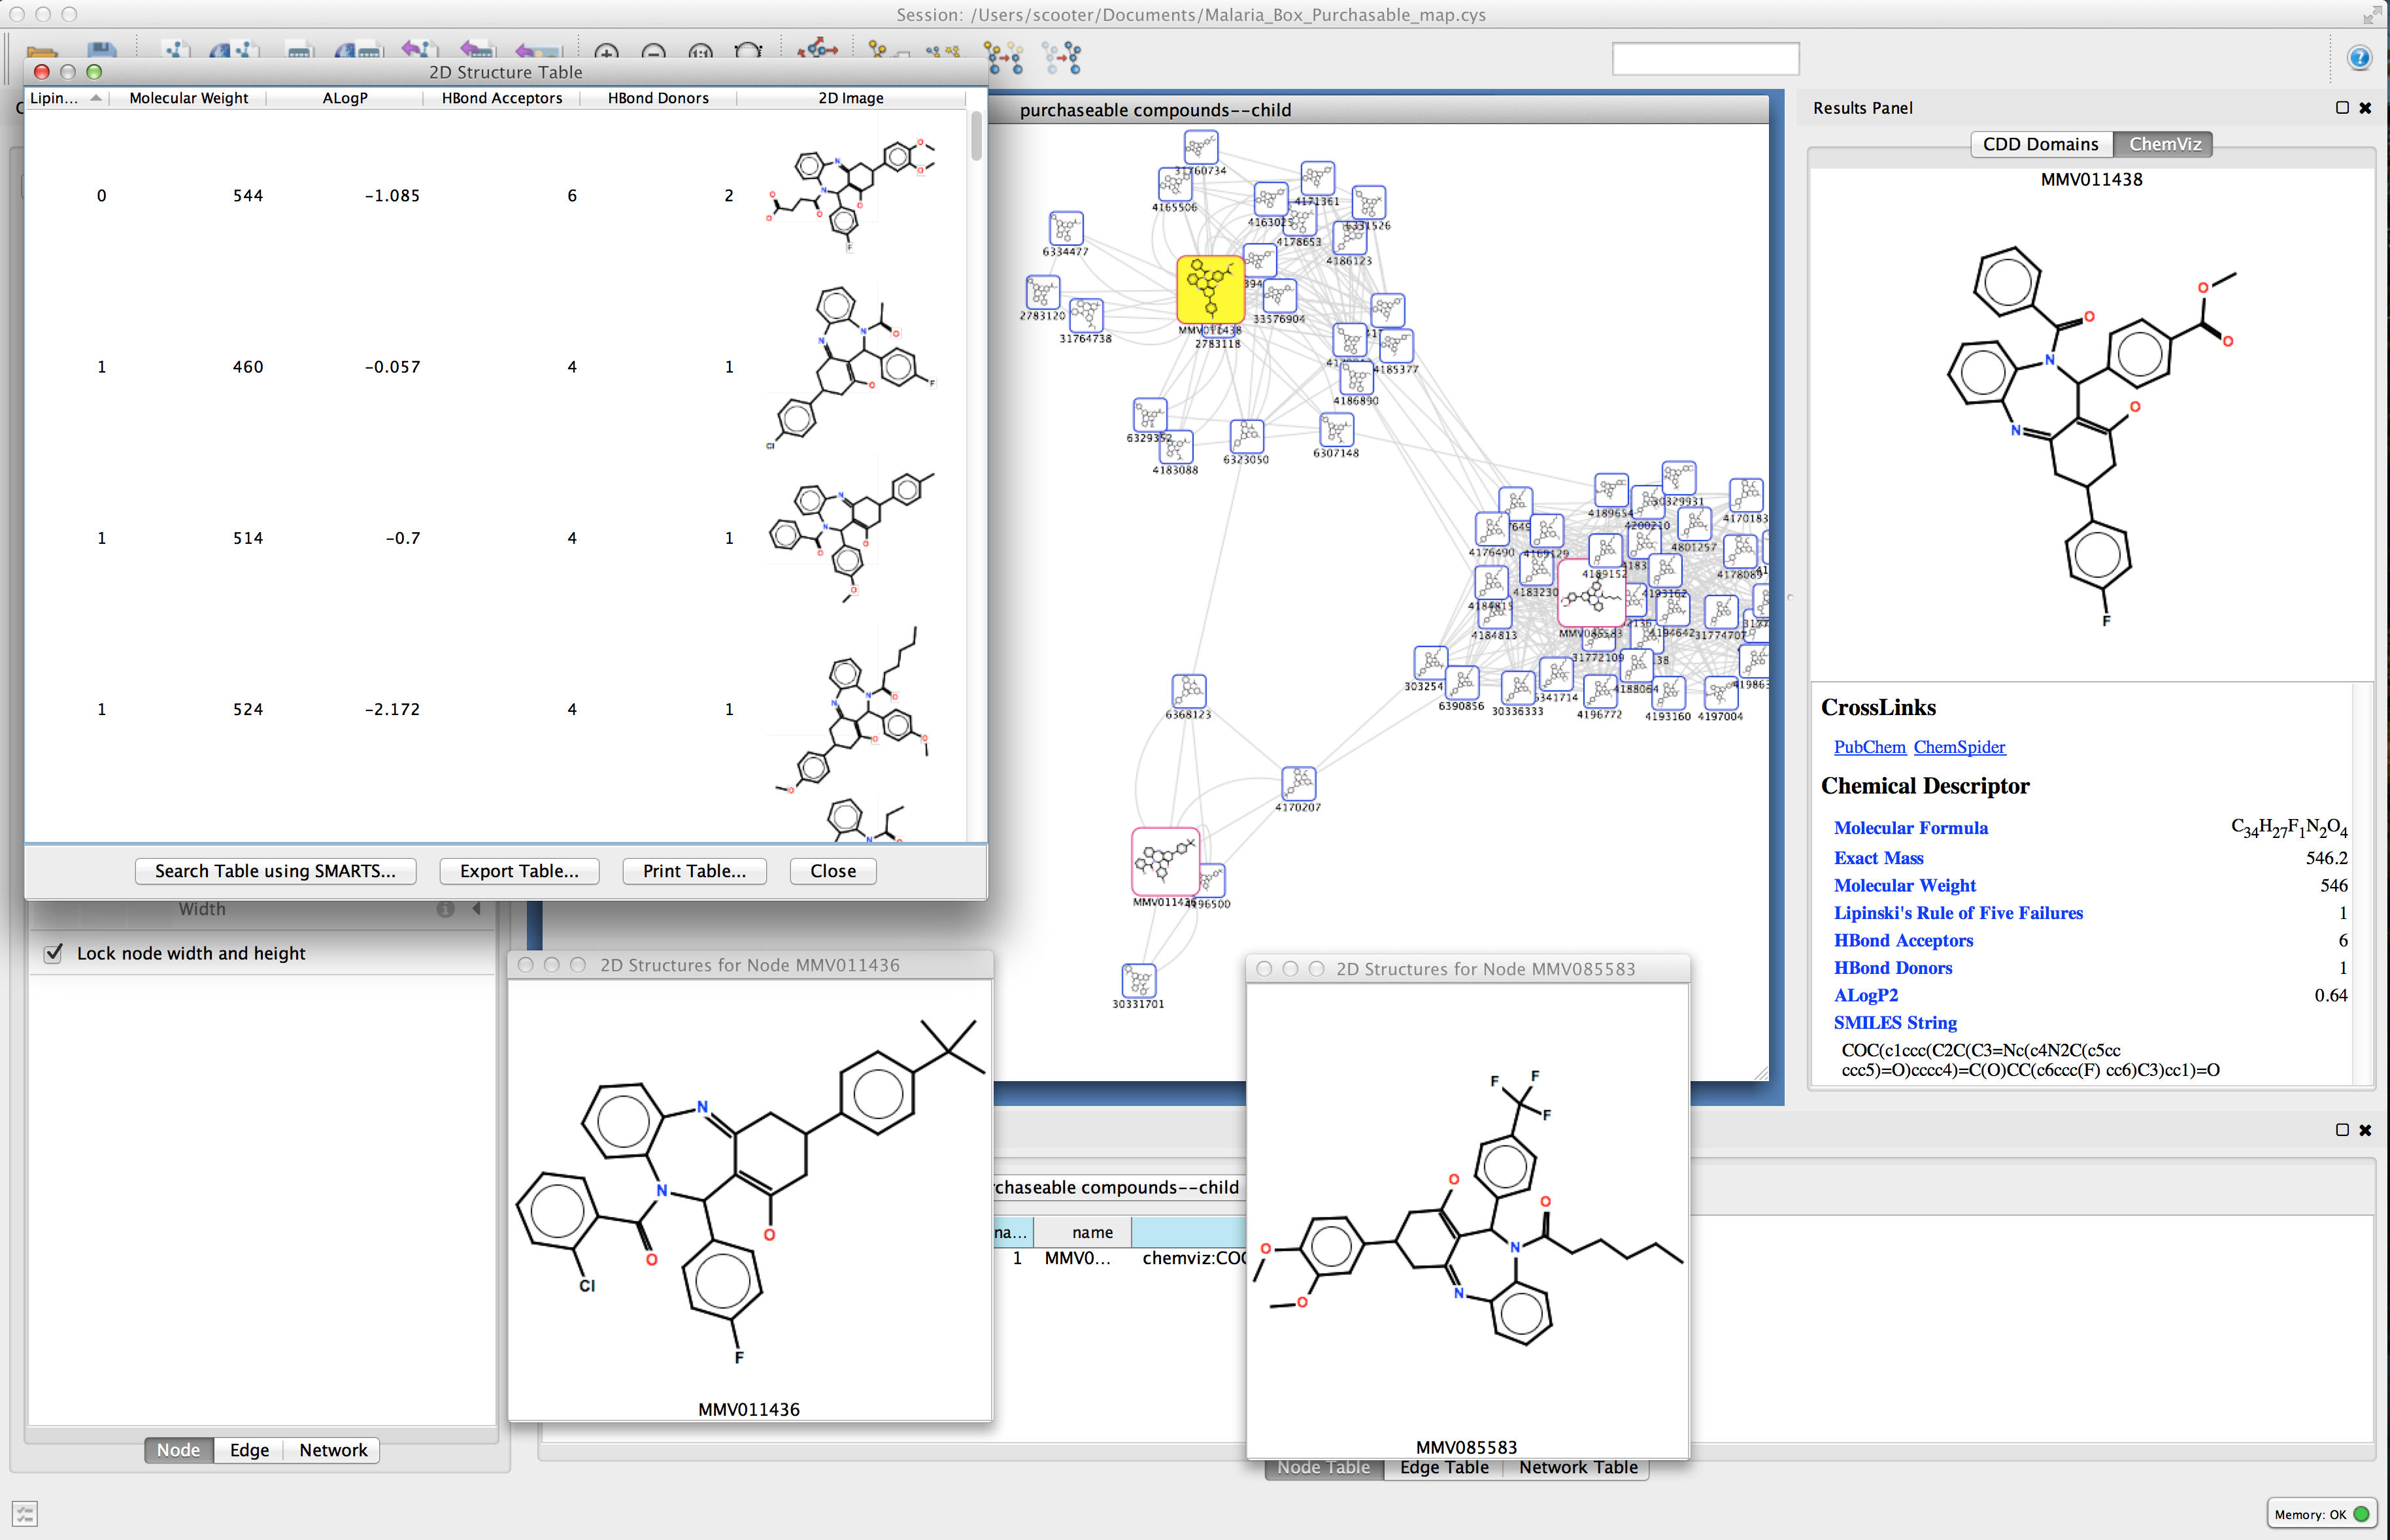
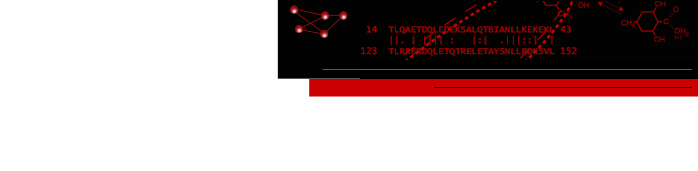
Figure 1. chemViz2 in action. This example shows a portion of a network of compounds similar to a compound that was a "hit" in an assay for activity against malaria. A 2D Structure Table has been generated for the selected nodes, and the number of hydrogen bond acceptors and donors for the compounds have been calculated and added to the table. Larger images of two of the structures are shown. 2D structures for the compounds have been painted directly onto the nodes. and the Results Panel shows one of the compounds that tested positive in the assay.
UCSF chemViz2 is a Cytoscape app that extends the capabilities of Cytoscape into the domain of cheminformatics. chemViz2 displays 2D diagrams of compounds specified by InCHI or SMILES strings. chemViz2 can also calculate Tanimoto similarities of compounds and use the values to create chemical similarity networks. Part of such a network is shown above. The 2D diagrams can be presented as scalable independent windows or as part of a table also showing Cytoscape attributes and calculated compound descriptors, including number of hydrogen bond donors, number of hydrogen bond acceptors, molecular weight, ALogP, molecular refractivity, number of Rule of Five violations, and several more. Any of the calculated descriptors can be mapped onto Cytsocape attributes where they can be used by the VizMapper and saved with the session. In the network above, nodes are colored by the number of hydrogen bond acceptors and node borders are colored by the number of hydrogen bond donors. chemViz2 depends on version 3.0 of Cytoscape and is available from the Cytoscape app manager or apps web site.
Installation
chemViz2 is available through the Cytoscape App store or the App Manager. To download chemViz2 using the app manager, you must be running Cytoscape 3.1 or newer. To install chemViz2 start Cytoscape 3.1 or better and either navigate directly to the Cytoscape App Store using a web browser, or bring up the App Manager (Apps→App Manager). chemViz2 is tagged with them molecular structure tag, or you can just search for chemViz2. In either approach, select the app and press Install.
The chemViz2 source is available on github at https://github.com/RBVI/chemViz2.
Menus
chemViz2 functionality is available through a "global" menu under the Apps and as either node or edge context menus. In any of the cases, chemViz2 provides a Cheminformatics Tools submenu. Chemical information is appropriate on either edges or nodes, so the global submenu provides submenus that allow the user to indicate whether the action should be performed on all nodes, all edges, selected nodes, or selected edges. The selected nodes menu will only appear if nodes are selected. Similarly, the selected edges menu will appear only if edges are selected. The all nodes and all edges menu items will always appear, but will be disabled (grayed out) if chemical information is not detected on any or the nodes or edges, respectively. Obviously, the chemViz2 node and edge context menus only apply to nodes or edges, as appropriate, and most items will be disabled (grayed out) if no chemical information is detected on any of the selected nodes or edges as appropriate.
The exception to the above discussion is the Settings... menu, which has no submenus since its only function is to bring up the settings dialog. The settings dialog is discussed in more detail in the next section.
Settings
The first step in using chemViz2 is to adjust the settings to correspond to your network attributes. By default chemViz2 will look for SMILES strings in the Cytoscape attributes: SMILES, Smiles, smiles, Compounds, or Compound. InCHI strings will be searched for in the attributes: InCHI, inchi, InChi, or InChI. These attributes may contain Cytoscape lists or comma-separated values. Either of these settings can be overridden through the Settings... dialog (see Figure 2). The Settings... dialog can also be used to change the default cutoffs for creating similarity edges and restricting the number of compounds to show in a single 2D popup. Each of the settings is discussed briefly below.
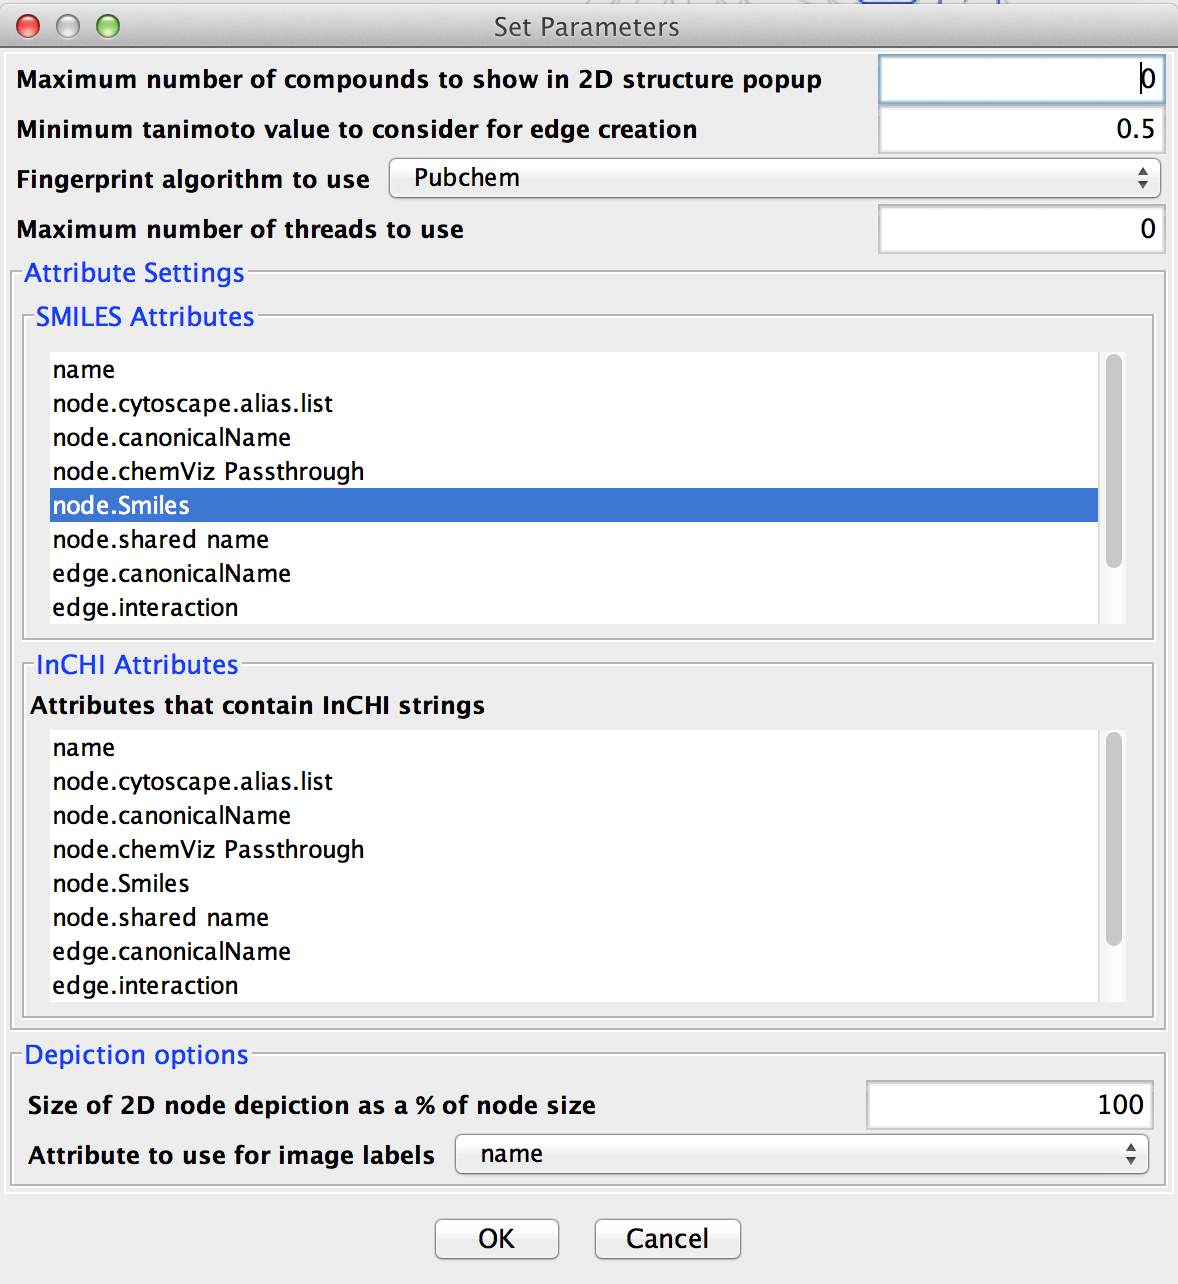
Figure 2. The ChemViz2 Settings Dialog. This dialog allows users to customize the settings used by chemViz2 for various cutoffs and settings
- Maximum number of compounds to show in 2D structure popup
- chemViz2 has three ways of displaying the 2D structures corresponding to SMILES or InCHI strings. For multiple nodes or edges or for nodes and edges with large numbers of compounds, the easiest way to view the compounds is with a table that includes not only a 2D representation of the compound, but also information about the node or edge associated with the compound or calculated chemical descriptors such as the molecular weight. The second way is to display the compound structure directly on the node. The final way to display compound structures is as a small popup with just the selected structures displayed. If the number of structures is large, this popup can be very slow and the structures so small as to be unusable. The value in this field is used to limit the number of 2D structures included in a popup.
- Minimum tanimoto value to consider for edge creation
- When using chemViz2 to create a new network or new edges based on the similarity between two compounds it is customary to choose a reasonable minimum value to consider for the creation of an edge between two compounds since drawing an edge between two dissimilar compounds may not be useful for either analytical or visualization purposes.
- Fingerprint algorithm to use
-
chemViz2 supports a number of different fingerprints that may be used for computing similarity.
The default fingerprint is the Pubchem, alternatives include MACCS, CDK, and
Extended CDK.
- Pubchem
- The fingerprints used by the NCBI Pubchem repository
- MACCS
- 166 bit MACCS keys based on the original MDL Molecular ACCess System fingerpints
- CDK
- 1024 bit fingerprinter provided as part of the CDK package
- ECFP4
- Extended-Connectivity fingerprint (also known as circular or Morgan fingerprint) using properties from the Daylight atomic invariants rule and limiting the subgraphs to a diameter of size 4. [see Rogers, D., Hahn, M. Extended-Connectivity Fingerprints, Journal of Chemical Information and Modeling, 2010, 50(5):742-754].
- ECFP6
- Extended-Connectivity fingerprint (also known as circular or Morgan fingerprint) using properties from the Daylight atomic invariants rule and limiting the subgraphs to a diameter of size 6.
- E-State
- 79 bit fingerprints using the E-State (Electrotopological state) fragments
- Extended CDK
- Generates a fingerprint with additional bits describing ring features
- FCFP4
- Extended-Connectivity fingerprint (also known as circular or Morgan fingerprint) using properties derived from the functional class (i.e. pharmacophore role) of the atoms in a molecule. The subgraphs for FCFP4 are limited to a diameter of 4.
- FCFP6
- Extended-Connectivity fingerprint (also known as circular or Morgan fingerprint) using properties derived from the functional class (i.e. pharmacophore role) of the atoms in a molecule. The subgraphs for FCFP4 are limited to a diameter of 6.
- Graph Only
- Specialized fingerprinter that doesn't take bond orders into account
- Hybridization
- A version of the CDK fingerprinter that doesn't take into account aromaticity. Instead, it takes into account SP2 hybridization
- Klekota & Roth
- SMARTS based substructure fingerprint based on Chemical substructures that enrich for biological activity [Klekota, Justin and Roth, Frederick P., Chemical substructures that enrich for biological activity, Bioinformatics, 2008, 24:2518-2525].
- Maximum number of threads to use
- Many of the chemViz2 operations will use multiple cores if they are available. This option limits the number of threads (cores) that may be used simultaneously. A value of 0 will use the number of cores minus one.
- Attributes that contain SMILES strings
- Select the list of attributes that chemViz2 will use to search for SMILES strings. Node or edge attributes can be selected from the list. This is a multiple-selection dialog, so multiple attributes can be selected by holding down the Control key.
- Attributes that contain InCHI strings
- Select the list of attributes that chemViz2 will use to search for InCHI strings. Node or edge attributes can be selected from the list. This is a multiple-selection dialog, so multiple attributes can be selected by holding down the Control key.
- Size of 2D node depiction as a % of node size
- By default, when chemViz2 paints 2D depictions of compounds onto the nodes, the size of the depiction is approximately the same size as the node (100%). Adjusting this value will change the size of the 2D depiction in relation to the size of the node.
- Attribute to use for image label
- For structure windows that contain more than one structure, either because more than one node is represented or because there is more than one compound in a given node, chemViz2 will add a label in the window. This option allows the user to select a different attribute to use as the source for this label. By default the ID is used for the label.
Showing 2D Structures
As mentioned above, there are three ways to show the 2D representation of a chemical compound using chemViz2: the 2D structures popup, painting structures directly onto the nodes, and a 2D structure table. Each of these approaches is discussed below.
Figure 3. The 2D Structure Table showing five structures from nodes in a Cytoscape network. By resizing the popup frame, users can scale the structural representations. By default, the Lipinski descriptors are shown.
2D Structure Table
The most flexible way to display 2D structures and corresponding attributes and descriptors is through the chemViz2 2D Structure Table. This dialog displays a table which can include Cytoscape attributes, molecular descriptors, and the 2D depiction of a compound. A 2D Structure Table may be displayed for single node or edge, a group of nodes or edges, or all of the nodes or edges in the network. The 2D Structure Table may be displayed for a single node (or edge) or the currently selected set of nodes or edges using the node or edge context menu: Cheminformatics Tools→Show Compound Table for selected nodes(or edges). They can also be displayed using the main Apps menu: Apps→Cheminformatics Tools→Show Compound Table→for selected nodes(or edges) or Apps→Cheminformatics Tools→Show CompoundTable→for all nodes(or edges). Using any of these menus will bring up a table with default columns:
- Attribute
- - the Cytoscape attribute used to retrieve the SMILES or InCHI string,
- Molecular String
- - the SMILES or InCHI string,
- Molecular Wt.
- - the molecular weight of the compound,
- ALogP
- - ALogP value for the compound,
- HBond Acceptors
- - the number of hydrogen bond acceptors,
- HBond Donors
- - the number of hydrogen bond donors, and
- 2D Image
- - the 2D depiction of the compound.
A 2D Structure Table may be customized further by right-clicking on any of the column headers. This will bring up a context menu for that column which allows users to remove the column from the table (Remove Column), or by adding a new column using data from corresponding Cytoscape attributes (Add New Column→Cytoscape attributes→) or calculated molecular descriptors (Add New Column→Molecular descriptors→). See the section below on Calculating Molecule Descriptors for a list of possible descriptors. This capability allows molecular descriptors, cytoscape attributes and 2D depictions of the structures to be displayed in a table, sorted, and compared. Selecting any row in the table will select the corresponding node or edge. Similarly, selecting any node or edge that is represented in the table will select the corresponding rows in the table.
At the bottom of the 2D Structure Table are four buttons:
- Search Table using SMARTS...:
- Allows the user to enter a SMARTS query and searches all compounds in the table for matches. Rows that contain matching compounds will be selected (which will also select the corresponding nodes or edges in the network).
- Export Table...:
- Exports the contents of the table to a comma-separated text file. At this point, the 2D Image column can not be exported
- Print Table...:
- Provides the capability of printing the contents of the table (including the 2D Image column)
- Close:
- Closes the table, although the compound information will remain cached to speed further access
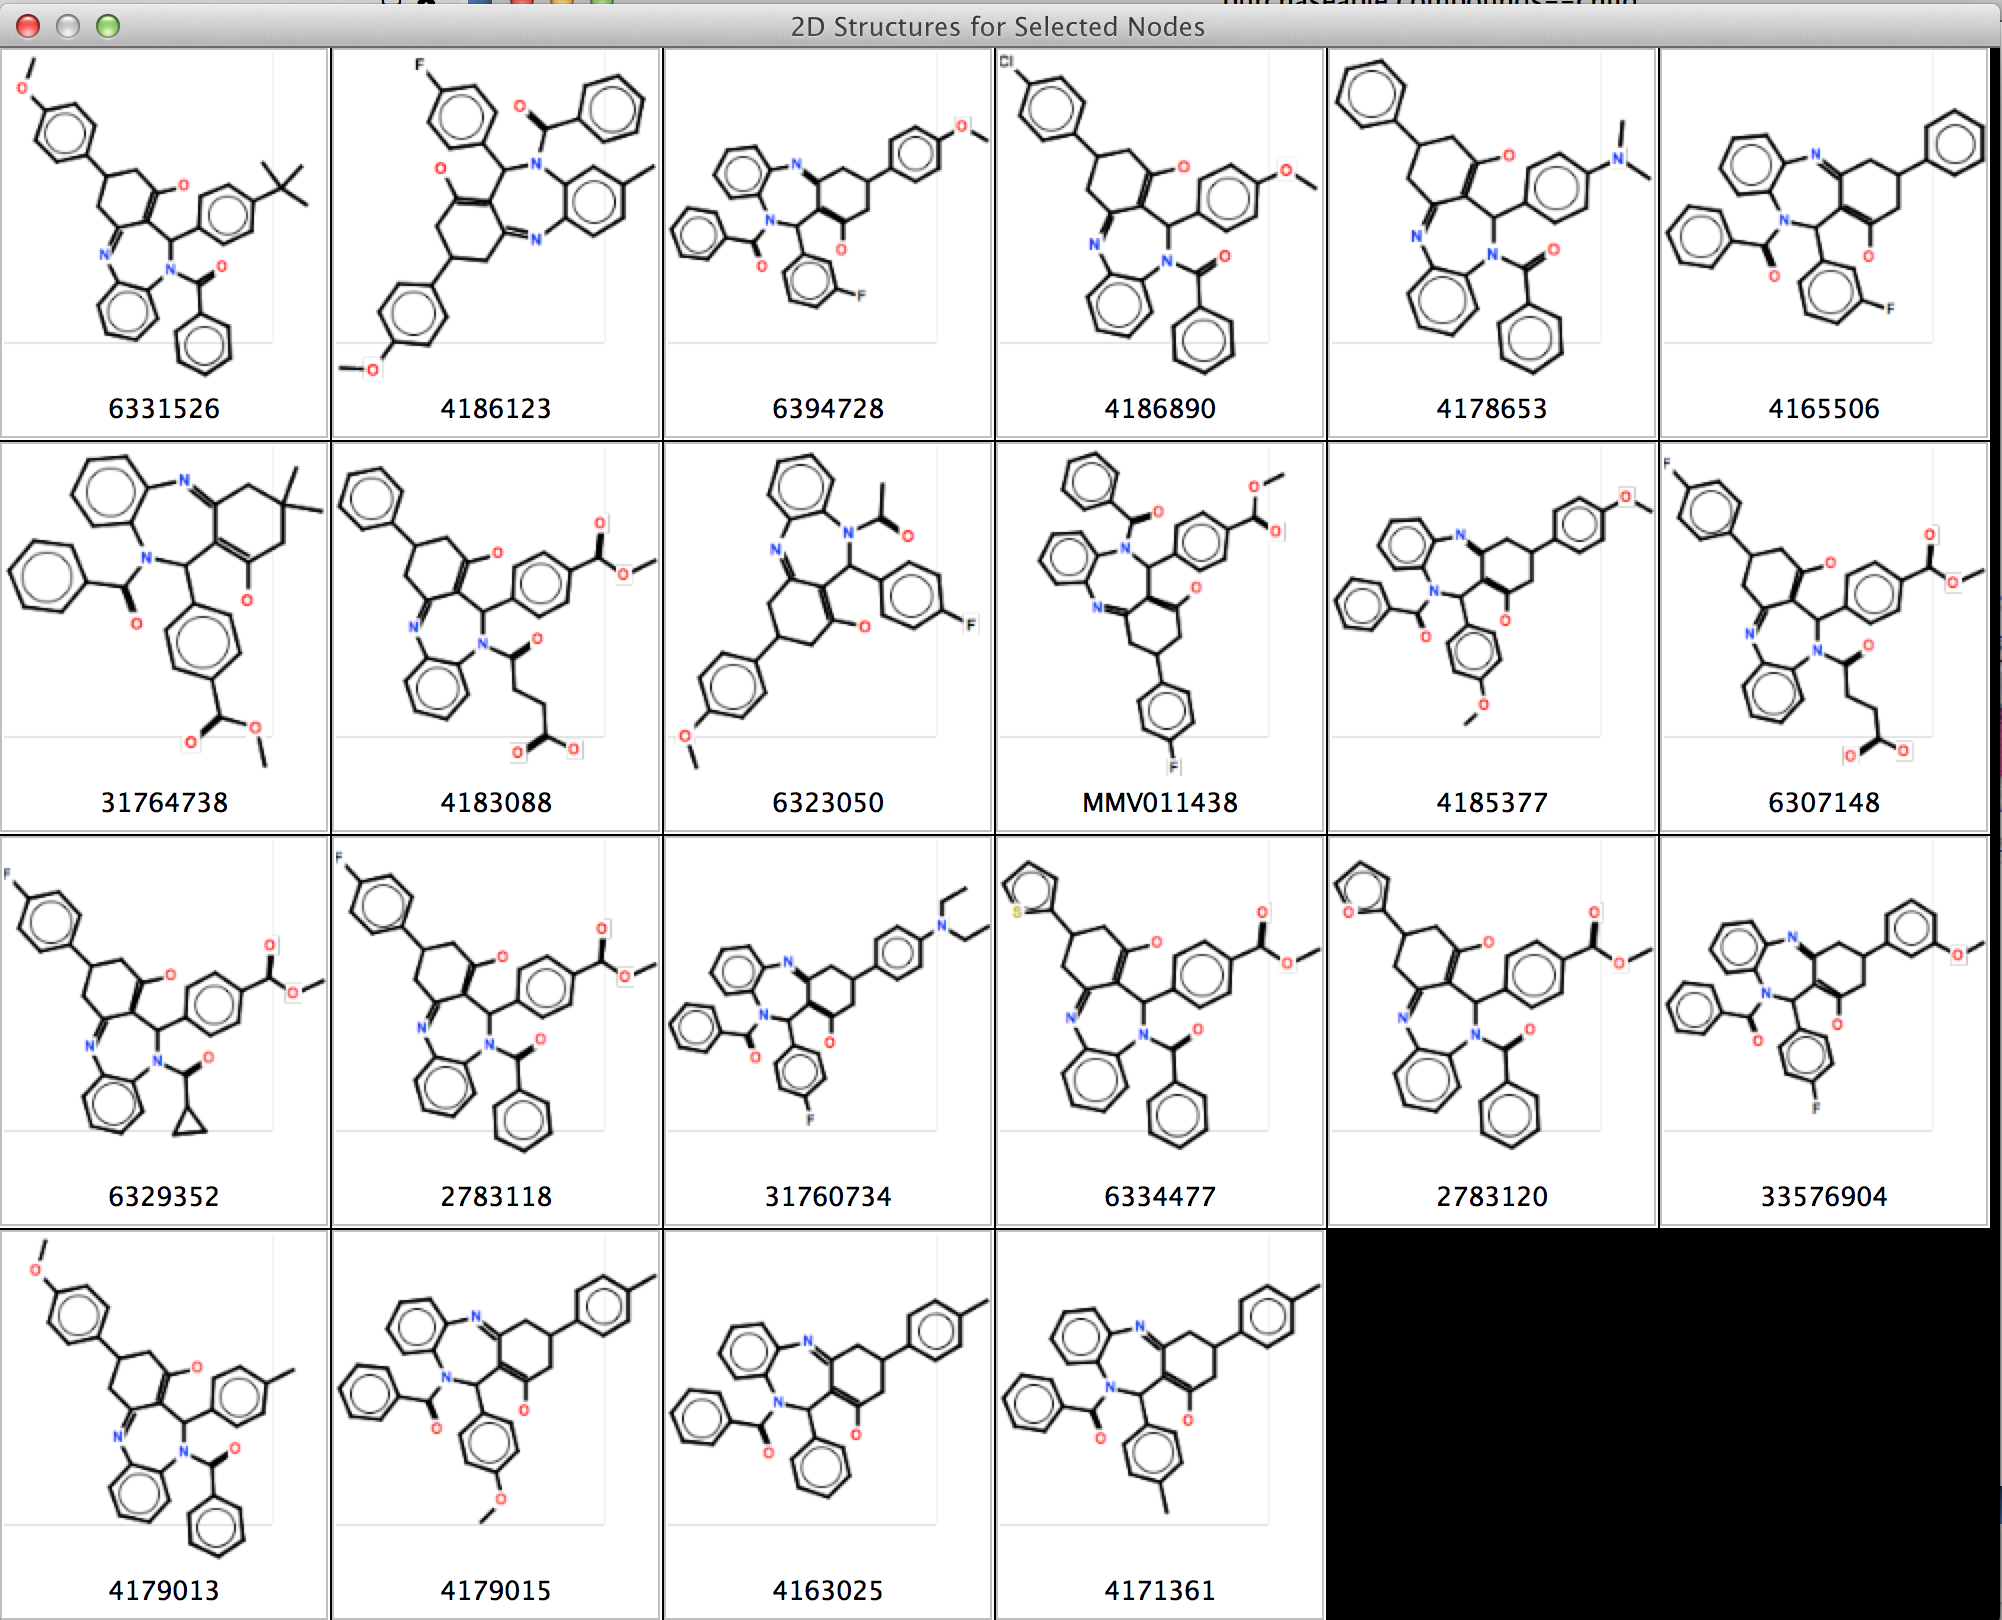
Figure 4. The 2D Structures Popup showing six structures from a node in a Cytoscape network. By resizing the popup frame, users can scale the structural representations.
2D Structures Popup
The 2D structures popup may be displayed for any node or edge with either SMILES or InCHI attributes using the edge or node context menu: Cheminformatics Tools→Show structures for selected nodes(or edge). This will bring up a dialog with 2D representations for all of the compounds described by the SMILES or InCHI strings associated with that node or edge. The popup is resizable and the 2D structure representations will scale to match the size of the popup. Figure 4 shows the result of requesting the 2D structures popup for a node with 6 structures annotated.
In additional to using the context menu, the 2D structure popup is available by double-clicking on a 2D structure in the 2D structure table (see above).

Figure 5. The 2D Structures Painted onto Nodes showing six structures from a node in a Cytoscape network. By resizing the popup frame, users can scale the structural representations.
Painting structures onto nodes
The final way to display chemical structures is by painting a 2D representation of the structures directly onto the nodes in a network. This may done from either the main menu or the node context menu. In either case, the menu Cheminformatics Tools→Paint structures on selected nodes is used to add the structures to the nodes. The main menu will allow all nodes to be painted as well as just the selected nodes. The node context menu only allows selected nodes to be painted. By default, the 2D structure depictions are positioned in the center of the node and are roughly the same size as the node bounding box. These defaults may be changed by adjusting the Position of the 2D depiction on the node and Size of 2D node depiction as a % of node size settings, repectively.
Once a 2D structure depiction is painted on the node, it is governed by all of the normal Cytoscape rules for node graphics. If the network zoom is changed, the depiction will be updated to reflect the new zoom value. In addition, exports of the network view will contain the structural depictions also. These depictions are drawn using vector drawing primitives, so exporting a network view using PDF will preserve the ability to zoom the document without any loss of resolution. One other point to note about the painted structures. By default, the algorithms in CDK that draw structures are very careful about drawing the atom labels in a way the the bonds are occluded. This is done by setting a background color for the font. chemViz2 attempts to mimic this behavior by setting the background color of the font to match the node fill. At times this may require the color of the node to change or otherwize be modified to improve the readability of the structure depiction.
To remove the structure depictions from nodes, use the Cheminformatics Tools→Remove structures from selected nodes in either menu. If changes are made to the settings or the structures themselves, if may be necessary to remove and repaint the structures.
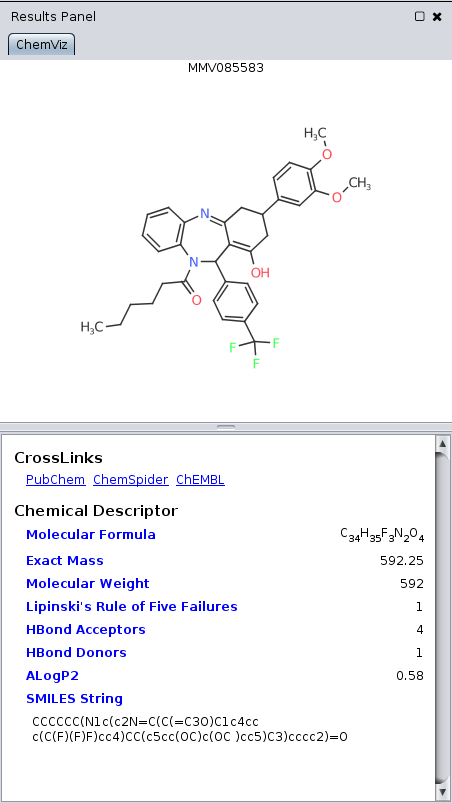
Figure 6. The chemViz2 Results Panel showing a single structure, it's standard descriptors, and links to PubChem, ChemSpider, and ChEMBL.
Side (Results) Panel
In addition to showing chemical information in tables, on the nodes, and in various popups, summary information may also be shown in the Cytoscape Results Panel. To activate this for chemViz2, select: Apps→Cheminformatics Tools→Show Results Panel. This will add a panel on the right-hand side of the main Cytoscape network display. When you click on a single node with a single compound annotation, the results panel will display the compound structure, summary information about the compound, and links PubChem, ChemSpider, and (if available) ChEMBL. If multiple nodes are selected, the Results Panel shows a view similar to the 2D Structures Popup discussed above. To disable the Results Panel, select: Apps→Cheminformatics Tools→Hide Results Panel.Calculating Molecular Descriptors
chemViz2 uses the open-source Chemistry Development Kit (CDK) for 2D depictions and calculating molecular descriptors for the compounds. By default, CDK uses 1024 bit standard hashed fingerprints that ignore cyclic systems, and at this point, chemViz2 just uses the default fingerprinting mechanism. Other fingerprints are possible with CDK, but the default fingerprints have been shown to be adequate for most purposes. CDK provides a large number of molecular descriptors, some of which can be calculated directly from the SMILES/InCHI (and resulting fingerprints) and some of which require conversion of the compound into a three-dimensional structure. This conversion can be computationally expensive and error-prone if the appropriate templates are not available. For that reason, chemViz2 will only calculate the molecular descriptors described below:
- Lipinski parameters
- This is the set of parameters Molecular Wt., ALogP, HBond Acceptors, and HBond Donors
- SDF parameters
- This is the set of parameters most often associated with Structure Data Format (SDF) files: XLogP, Topological Polar Surface Area, and Zagreb Index.
- ALogP
- The 1-octanol/water partition coefficient, logP (calculated following the Ghose and Crippen (1986) LOGKow algorithm)
- ALogP2
- This is the square of the ALogP value - i.e. ALogP2.
- Aromatic ring count
- The number of aromatic rings in the structure
- Atomic composition
- This is the atomic composition measure defined in the paper: The structures and physicochemical properties of organic cofactors in biocatalysis. J Mol Biol. 2010. This measure is simply a measure of the fraction of polar heavy atoms: (#N+#O+#S+#P)/(#C+#N+#O+#S+#P)
- Exact Mass
- The total exact mass of the molecule, assuming the "standard" isotope for each element.
- Heavy atom count
- The total number of non-hydrogens in the compound.
- HBond Acceptors
- The number of possible hydrogen bond acceptors in this compound
- HBond Donors
- The number of possible hydrogen bond donors in this compound
- Length over Breadth Max
- The maximum length over breadth value.
- Length over Breadth Min
- The minimum length over breadth value.
- Lipinski's Rule of Five Failures
- The number of Lipinski "Rule of Five" failures calculated for the structure.
- Molar refractivity
- The molar refractivity of the compound following the Ghose and Crippen (1987) method
- Ring count
- The number of rings in the compound.
- Rotatable Bonds Count
- The number of rotatable bonds in this compound
- Topological Polar Surface Area
- The 2D estimated tpological polar surface area based on fragment contributions (TPSA).
- Total Number of Bonds
- The number of bonds in the structure.
- Wiener Path
- The Wiener path number: half the sum of all atom distances in the structure.
- Wiener Polarity
- The number of 3 bond length distances in the molecule
- XLogP
- Prediction of logP based on the atom-type method called XLogP. More information on the method is available at Wang, R., Fu, Y., and Lai, L., A New Atom-Additive Method for Calculating Partition Coefficients, Journal of Chemical Information and Computer Sciences, 1997, 37:615-621 and Wang, R., Gao, Y., and Lai, L., Calculating partition coefficient by atom-additive method, Perspectives in Drug Discovery and Design, 2000, 19:47-66
- Zagreb Index
- The sum of the squared atom degrees of all heavy atoms.
As mentioned above, chemViz2 can be used to add values for molecular descriptors to a 2D Structure Table by using the Add New Column→Molecular descriptors→ context menu that is available on the column headers. In addition, the node or edge context menus and the Apps→Cheminformatics Tools menu contain a Create attributes from Compound Descriptors menu. Executing this menu will create new Cytoscape attributes and calculate the appropriate values for the compounds associated with the nodes and/or edges.
Searching the Network for Matching Compounds
As network get increasingly complex, it might be useful to search the network for compounds that contain some substructure. This is done using SMARTS queries by selecting Cheminformatics Tool→Search using SMARTS in either the context menu or the Apps menu. In either case, the user is prompted for a SMARTS query and the network is searched for matching compounds. The nodes or edges that match the query are selected.
Calculating the Maximum Common SubStructure (MCSS)
Given a group of compounds, a useful operation to determine the maximum common substructure of all of those compounds. This may be useful, for example, to suggest important common structural elements of compounds that might be biologically active or those that might not. chemViz2 provides this capability with the Cheminformatics Tools→Calculate Maximum Common SubStructure (MCSS) menu items in both the Apps menu and the context menus. chemViz2 will iteratively step through all of the compounds of the network, or selected nodes and edges and popup a structure window that shows the MCSS. The SMILES string the MCSS is shown in the bottom of the window and the text is selectable for copy/paste operations.
In addition to the ability to popup a structure window, the MCSS menus have an additional menu item: Cheminformatics Tools→Calculate Maximum Common SubStructure (MCSS)→and group selected nodes. This will create a group node that contains all of the selected nodes. The compound attribute for that node will contain the SMILES string of the MCSS.
Calculating Molecular Similarity
A common task for cheminformatics tools is to calculate the similarity of two compounds. The usual mechanism to doing this is calculating the Tanimoto coefficients between the two compounds, which is a measure of the similarity of the two compounds based on the angle between the attribute vectors (fingerprint) of each compound. Thus this measure is dependent on the specific fingerprint descriptor used. Common descriptors are MACCS, PubChem, and Daylight. The CDK used a 1024 bit hashed fingerprint, which ignores cyclic systems.
chemViz2 provides In addition, both the node or edge context menus and the Apps→Cheminformatics Tools menu contain a Create Similarity Network submenu. If no nodes are selected, the Tanimoto coefficients for all nodes are calculated and a new network is generated with an edge between all node pairs where the Tanimoto coefficient is larger than the Minimum tanimoto value to consider for edge creation setting from the Settings Dialog. If more than one node is selected the Tanimoto Coefficients menu becomes a submenu with two options: for all nodes and for selected nodes. In either case, a new network is created with the edges representing the Tanimoto similarity. To aid in determining the specific compounds, the original positions of the nodes are retained in the new network.
chemViz2 commands
In order to facilitate the use of chemViz2 from other apps, the chemViz2 app exports a number of commands. These commands may be used by other apps, or as part of scripts that can be executed using the build-in command line functionality of Cytoscape 3.x.
There are a number of arguments which are repeated for several of the commands. In particular: nodeList, edgeList, and network are defined here and referenced from each of the commands outlined below:
- nodeList
- This is a list of nodes which may be specified using one of the special keywords:
- selected: all selected nodes in the specified network (view)
- all: all nodes in the specified network (view)
- column:value: will be converted into all nodes with the attribute value value for the attribute attribute
- edgeList
- This is a list of edges which may be specified using one of the special keywords:
- selected: all selected edges in the specified network (view)
- all: all edges in the specified network
- column:value: will be converted into all edges with the attribute value value for the attribute attribute
- network
- This is the network to operate on and may be specified by the special keyword:
- current: currently selected network
In general, all of the commands include several arguments, which are described below the command description. The arguments and their values are specified as name, value pairs separated by an equals sign (=). For example, to calculate the MCSS of a group of nodes, the user might enter:
chemviz calculate mcss nodeList="assayHit:true" network="current" showResult=trueNote that the text arguments are placed within quotes.
If the argument has a default value, that value is shown below in brackets ([]). Literal values, such as the booleans true and false or the keyword selected are shown in bold, while descriptions of the argument type such as nodeList or edgeList are shown in italics.
- chemviz calculate mcss
- Calculate the Maximum Common SubStructure for a set of nodes or edges.
- chemviz create attributes
- Create Cytoscape attributes for molecular descriptors
- chemviz create smilarity
- Create a similarity network from a set of nodes
- chemviz hide results
- Hide chemViz results panel
- chemviz paint structures
- Paint 2D structures on the nodes
Arguments:
- nodeList=nodeList: The list of nodes to paint the structures on
- chemviz remove structures
- Remove 2D structures from nodes
Arguments:
- nodeList=nodeList: The list of nodes to remove the structures from
- chemviz search
- Search structures using SMARTS
- chemviz settings
- Set chemViz properties
Arguments:
- fingerprinter=[Pubchem|MACCS|CDK|E-State|Extended CDK|Graph Only|Hybridization|Klekota & Roth|Substructure bitset]: Fingerprint algorithm to use
- inChiAttributes=column1,column2...: one or more columns to search for InCHI compound descriptors
- labelAttribute=labelColumn: The column to use for image labesl
- maxCompounds=integer: Maximum number of compounds to show in 2D structure popup
- maxThreads=integer: Maximum number of threads to use
- nodeStructureSize=intger: Size of 2D node depiction as a % of node size
- smilesAttributes=column1,column2...: one or more columns to search for SMILES compound descriptors
- tcCutoff=double: Minimum tanimoto value to consider for edge creation
- chemviz show compound structures
- Show the 2D structures popup
- chemviz show compound table
- Displays the compound table
- chemviz show results
- Enable chemViz results panel
Last updated on February 23, 2015
About RBVI | Projects | People | Publications | Resources | Visit Us
Copyright 2021 Regents of the University of California. All rights reserved.