

 about
projects
people
publications
resources
resources
visit us
visit us
search
search
about
projects
people
publications
resources
resources
visit us
visit us
search
search
Quick Links
Featured Citations
Running a genetic stop sign accelerates oxygen metabolism and energy production in horses. Castiglione GM, Chen X et al. Science. 2025 Mar 28;387(6741):eadr8589.
Structure and mechanism of the Zorya anti-phage defence system. Hu H, Popp PF et al. Nature. 2025 Mar 27;639(8056):1093-1101.
In-cell architecture of the mitochondrial respiratory chain. Waltz F, Righetto RD et al. Science. 2025 Mar 21;387(6740):1296-1301.
Structure and mechanism of vitamin-K-dependent γ-glutamyl carboxylase. Wang R, Chen B et al. Nature. 2025 Mar 20;639(8055):808–815.
Molecular basis of vitamin-K-driven γ-carboxylation at the membrane interface. Cao Q, Ammerman A et al. Nature. 2025 Mar 20;639(8055):816–824.
More citations...News
March 19, 2025

|
March 1, 2025
December 25, 2024

|
Upcoming Events
UCSF ChimeraX (or simply ChimeraX) is the next-generation molecular visualization program from the Resource for Biocomputing, Visualization, and Informatics (RBVI), following UCSF Chimera. ChimeraX can be downloaded free of charge for academic, government, nonprofit, and personal use. Commercial users, please see ChimeraX commercial licensing.
ChimeraX is developed with support from National Institutes of Health R01-GM129325.
Feature Highlight
Morphing between atomic structures can be calculated wih the
morph command
and played back in an animation.
This movie shows morphing between two conformations of the FGFR1 kinase domain:
Morphing and other setup was done with the
command file kmorph-prep.cxc,
followed by interactively positioning the structure and saving the view
with the command
view name p1
(generally a
session would
also be saved at this point),
then running kmorph-play.cxc
to add 2D labels and record the movie.
Example Image
The GDP- and GTP-bound conformations of the transducin α-subunit
(1tag and
1tnd, respectively) differ primarily in three regions,
termed switch 1, switch 2, and switch 3. The structures have been superimposed with
matchmaker
and shown as cartoons,
with “empty” outlines where the structures are almost the same
(for simplicity, only one conformation's outlines are shown).
The GTP analog GTPγS is displayed as spheres color-coded by heteroatom.
For 2D labels
and image setup other than structure orientation,
see the command file switch.cxc.
Morphing Movie
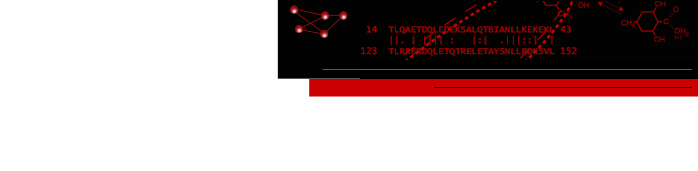
The tyrosine side chains and ATP analog are color-coded by element:
light blue carbon, red oxygen, blue nitrogen, and orange phosphorus.

G-Protein Switch Regions
About RBVI | Projects | People | Publications | Resources | Visit Us
Copyright 2018 Regents of the University of California. All rights reserved.