
Advisory Committee Meeting
November 13, 2009

|
| Schematic of HIV virus. |

| 
|
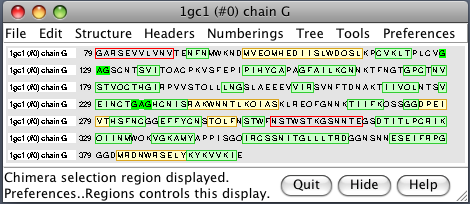
| PDB 1gc1: gp120 blue, antigen binding fragment (FAB) 17b yellow and red, CD4 cyan. | Sequence gp120 (1gc1 chain G): missing segments red, helices yellow, strands green. |
| 
| 
|
| gp120 structures found with BLAST. BLAST 1gc1 gp120 sequence against PDB using Chimera. 56 matching chains, 26 structures. | Aligned structures. Fetch some structures found by BLAST. Automatically aligned. | Structure with V3 loop. Sequence alignment shows 2B4C has V3 loop, only one other structure has it. V3 loop recognized by many antibodies. |

| 
|
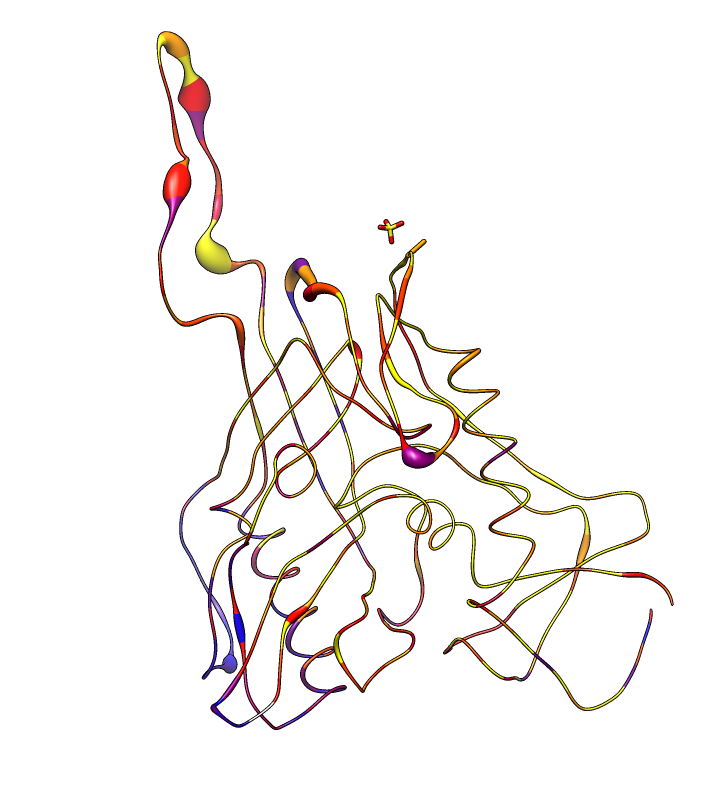
| HIV clades. 38 reference sequences from LANL HIV database. Clades in sequence names. Phylogenetic tree at left. | Cross-clade conservation. gp120 colored by residue conservation, yellow-red-blue most to least conserved. |

| 
|
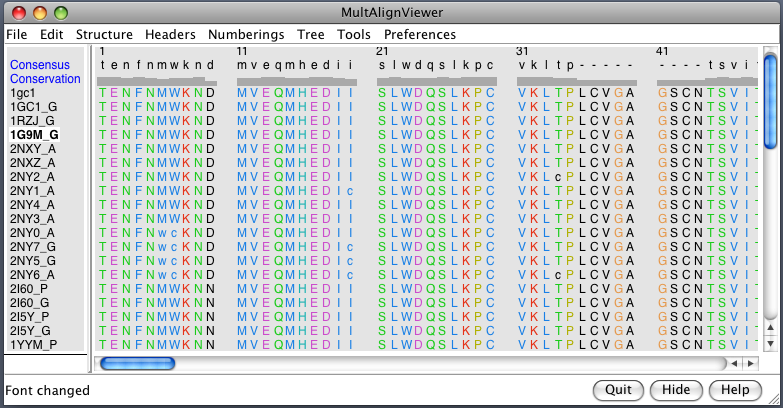
| Alanine scanning. Reduction in binding affinity of PG9 and PG16 when residues mutated to alanine shown as blue sequence headers. | Critical binding residues. Fatter tube at residues where PG16 binding reduced by substituting alanine. |
| 
|
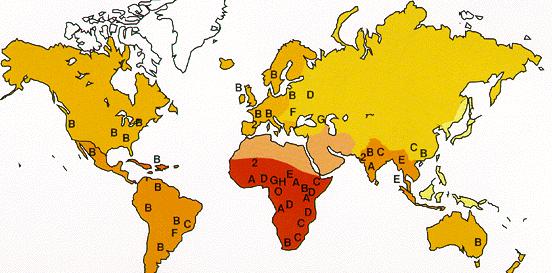
| Geographic distribution of HIV clades. | HIV infections, 2002. |
| 
|
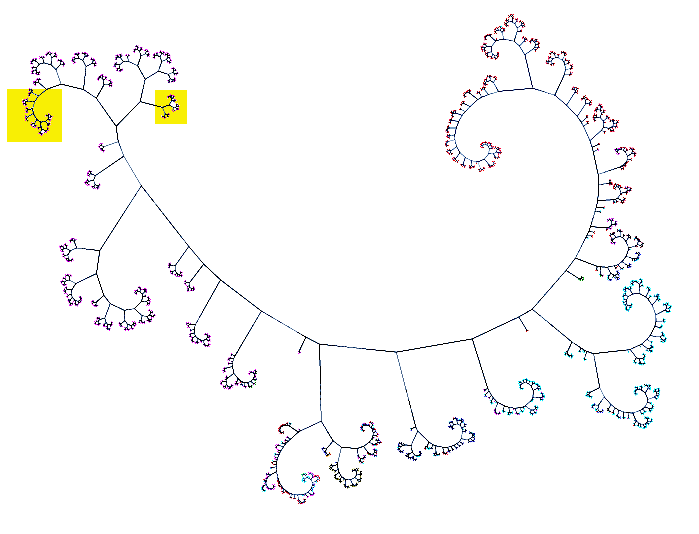
| HIV sequence tree: 1900+ HIV sequences from Los Alamos National Laboratory (LANL) HIV database viewed using Cytoscape network visualization developed by RBVI. Clade B pink, clade A cyan, clade C red. All PDB gp120 structures are in yellow boxes. | Close up: All but one of the gp120 sequences found in PDB structures (17 of 18 unique sequences) match the 5 HIV isolates shown here as yellow nodes. This region of is the left yellow box in full network image. |

| 
| |
| PG9 and PG16 binding location: Supplementary figure 6 from Walker LM, et al 2009 Science paper. Binding is hypothesized to be to v1/v2 loops (yellow) and v3 loop (orange). | Homology model: gp120 ModBase Q9YQN8. |

| 
|
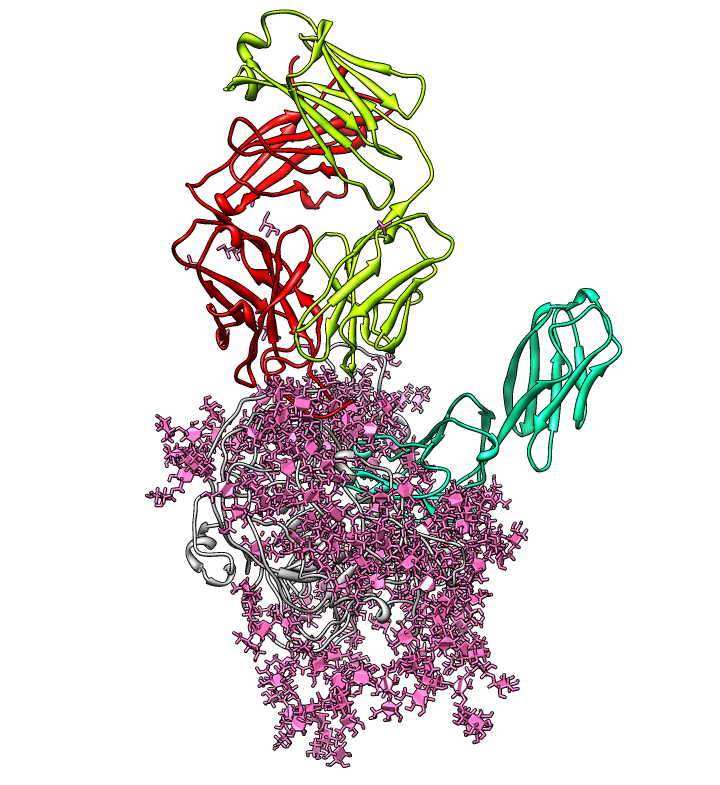
| Glycosylation sites on ModBase homology model Q9YQN8 found with prosite match N-x-[ST]. Note 8 sites on V1/V2 loop. Long color bands are badly spaced (10A apart) residues in homology model. | Consensus glycosylation model: Mass spectroscopy from Kenneth Tomer's lab (NIEHS) determined distribution of glycans (branched sugars) at each residue. Most common glycan for each residue used to hand-build a full length fully glycosylated model. |
| 
| 
|
| Glycans at binding sites. Locations of CD4 and FAB X5 by fitting 2B4C to glycosylated gp120 model. | Glycosylation model errors. Alignment of 2B4C and hand-built glycosylated model. RMSD header shows differences between structures. | V3 loops are very different in x-ray model (2005) and earlier glycosylation model (2000). |

| 
|
| SAXS profiles. Experimental gp120 SAX data pink + marks, glycosylated model green, modbase homology model cyan, glycosylated model with moved v1/v2 loop yellow. | Alternate V1/V2 loop models. Colors match calculated curves in SAXS profile plot. |

| 
|
| SIV virions. SIV virus tomography from Kenneth Roux's lab. | Single virus extracted from tomogram, smoothed, noise hidden, colored radially to show membrane (red) and spikes (yellow). |

|
| EMDB Search. EM Databank can be searched and maps downloaded directly from Chimera. Search term HIV. |
| 
| 
|
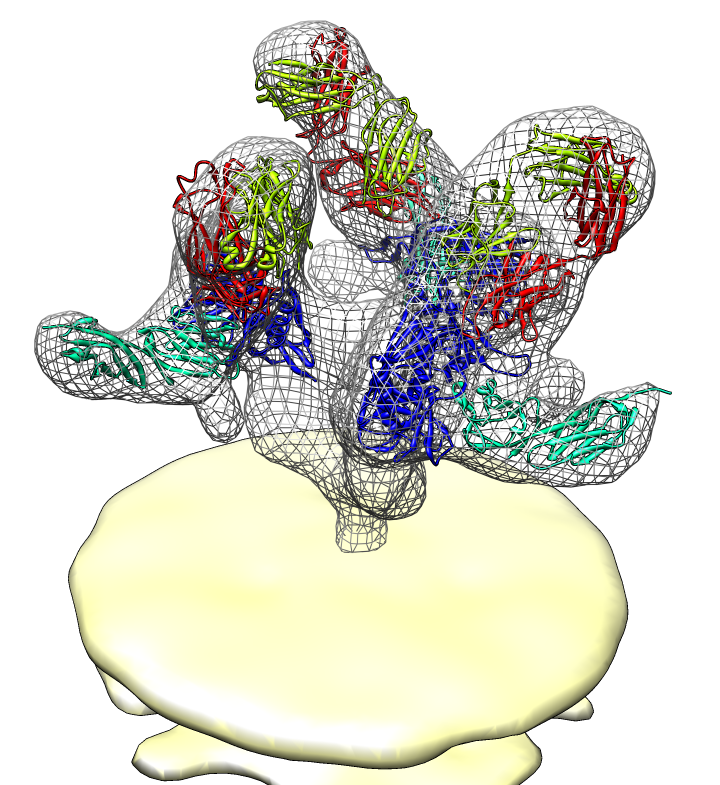
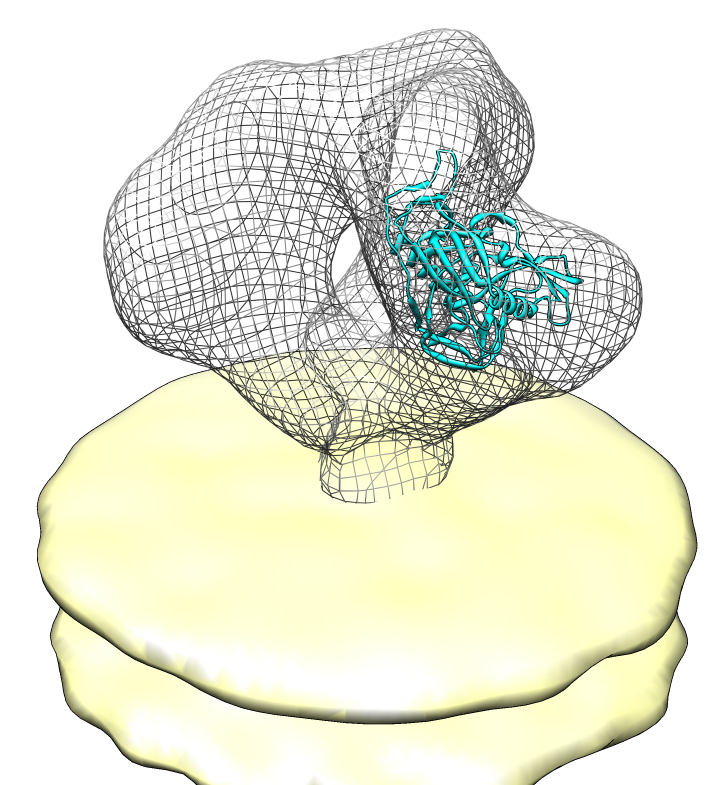
| Spike with ligands. Spike with CD4 and FAB 17b bound. C3 symmetry applied after fitting monomeric xray model. | Unbound spike. | Binding induced motion. Rotation of 60 degrees about orange rotation axis on binding CD4 and 17b. |
